How an On-Call Agent Narrows Down an Outage With Weighted Hypotheses
At 14:02 an alert fires: checkout’s p99 latency is 4.8 seconds, against a normal 300 ms. Whoever is on call, a person or an agent, starts with a handful of suspects. The connection pool could be exhausted. The release that went out at 13:58 could be bad. A cache node could be failing, or the payment provider could be slow. Each suspect comes with its own fix, and picking the wrong fix costs time during an outage.
This case study follows examples/incident, where an on-call agent keeps all four hypotheses open as branches until the clues single one out. The likelihoods in it are the agent’s judgment, the same call a person on call would make: how likely is this clue if that hypothesis is true? The engine applies them by fixed rules and keeps the record. The numbers come from the recorded output.
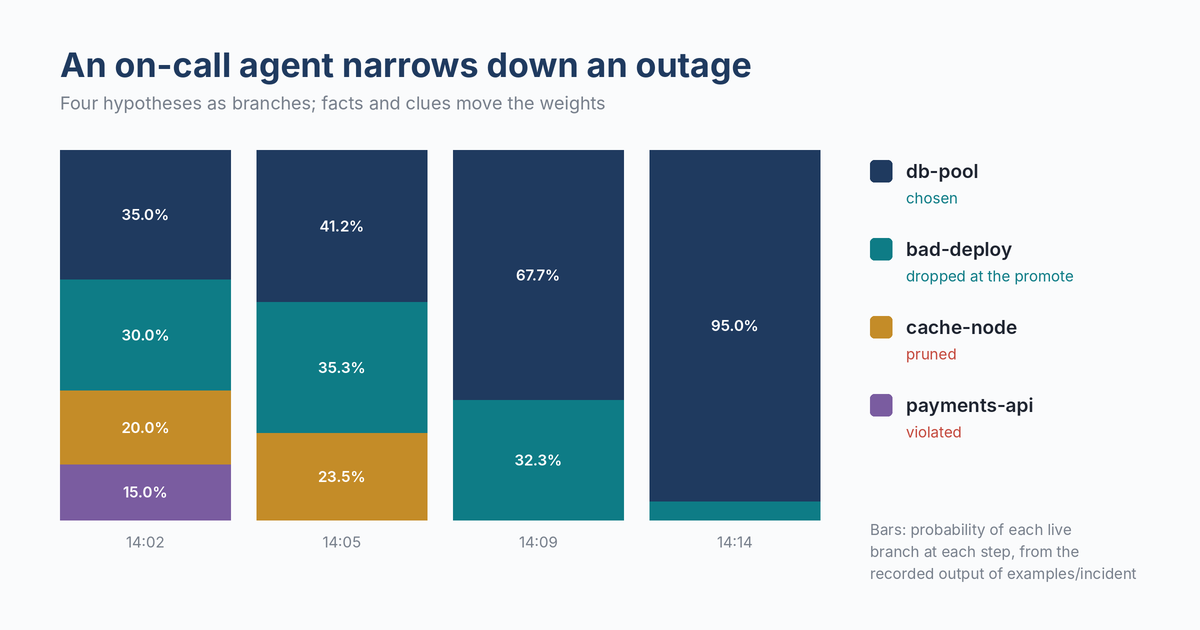 Each hypothesis’s probability after each clue, from the recorded run.
Four Suspects, Each With Its Fix
The agent forks one branch per hypothesis and writes the cause and the fix into it. The weights are its starting beliefs: 0.35 for the pool, 0.30 for the deploy, 0.20 for the cache node, 0.15 for the payment provider. The payments hypothesis gets a condition too. It only makes sense while the provider isn’t reporting normal:
s.Constrain("payments-api", mv.NotEquals("payments/status", "normal"))
Facts First, Then Clues
At 14:05 the agent checks the provider. Its status page says normal and its p99 is 210 ms. Those are facts, so they go to the trunk and to every branch at once, and the payments hypothesis dies on the spot because its condition broke. The other three renormalise to 41.2%, 35.3% and 23.5%.
At 14:09 the logs show 1,200 “timeout acquiring connection” errors in five minutes. The agent rates that clue at 0.9 if the pool is the cause, 0.5 if the deploy is, and 0.1 for the cache node. It also asks the engine to drop anything left under 5%:
s.Observe(mv.Evidence{
    Facts:       []mv.Fact{{Key: "logs/pool_timeouts_5m", Value: []byte("1200")}},
    Likelihoods: map[string]float64{"db-pool": 0.9, "bad-deploy": 0.5, "cache-node": 0.1},
    PruneBelow:  0.05,
})
The cache node falls to about 4% and is pruned. The pool now stands at 67.7% and the deploy at 32.3%.
At 14:14 a canary running the previous release, 4.11, shows the same timeouts. A rollback wouldn’t help, so the agent rates the clue 0.9 for the pool and 0.1 for the deploy. The pool goes to 95.0%.
Acting at 90%
The team’s rule is to act once one hypothesis passes 90%. At 14:15 the agent promotes the best branch. The pool’s fix, raising the pool from 50 to 120 and recycling idle connections, becomes the trunk’s plan. The deploy hypothesis was still live at 5.0%, and the promote drops it.
Every fact the agent gathered is on the trunk as well, from the provider’s status to the canary result. The store’s history reads like the incident timeline, showing when each hypothesis died and why. That’s the part a postmortem usually has to rebuild from chat logs. Try it with go run ./examples/incident.